2024 was a stellar year for equity markets. The performance of US-listed mega-cap tech stocks, particularly the Magnificent 7, has been incredible to watch. While the ASX 300 didn’t managed to keep pace, it still climbed a solid 11.4% in 2024. These returns have been great for investors focused on growth and AI-related thematics, but have made it hard for value investors to keep pace. While 2024 was tough for value managers, could 2025 be the year that investors start to pay attention to the price they pay for stocks again?
The equity rally has been impressive, but narrow
While equity markets have been very strong, most of the gains have been in a very small group of stocks. Globally the tech surge has been well documented, but in Australia the biggest driver of the ASX’s return has been financial stocks, with the sector dominated by the big banks. As you can see in the graph below, the financial sector contributed around 80% of the index’s returns this year, most of this from the big banks.
ASX 300 returns in 2024, by sector

Past performance is not a reliable indicator of future performance. Source: FactSet; As at 31 December 2024
Australia’s big four banks make up around 25% of the ASX 300’s market capitalisation, a much higher proportion than global markets. What is even more remarkable, is the banking sector’s rise of circa 35% in 2024 was delivered when banks’ earnings were essentially flat (CBA’s earnings were up the most at 3.8% for the year). When market rallies are narrow like this, it brings into question the sustainability and outlook for future returns. The reason is it is not indicative of a broad-based recovery, rather it tends to indicate market exuberance which could be a sign that markets are near a cyclical peak. The graph below shows the S&P 500’s peaks in 2000 and 2020 were preceded by very narrow participation.
Top 10 companies in the S&P 500: percentage of total market cap
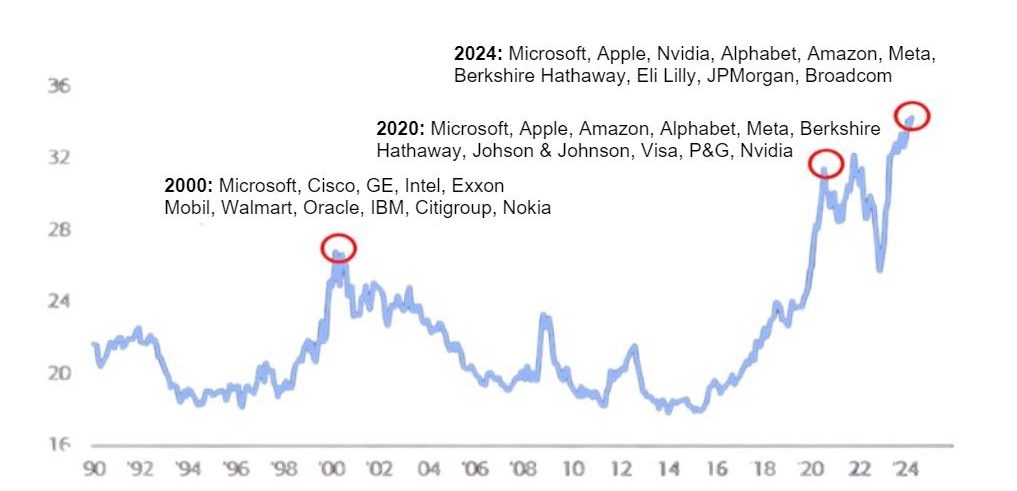
Past performance is not a reliable indicator of future performance. Source: Bank of America; As at 30 October 2024
As fundamental investors we have remained underweight the banking sector throughout the year, which has hurt our performance. While it has been painful watching this surge from the sidelines, when bank valuations are at historic highs as they are today, it seems highly likely that bank returns in 2025 will be poor.
Valuations are rising, while the equity risk premium is shrinking
Equity markets have repeatedly hit all-time highs in the US and Australia this year. What is particularly concerning is they are also looking historically expensive as earnings have not kept pace with share price rises. The Price to Earnings Ratio (PER) for the ASX All Industrials (which excludes resources) is near historic highs as you can see in the graph below. While the PER in 2021 was higher, at this time 10-year bond yields were around 1% and the RBA cash rate was at a record low of 0.1%. By contrast, now the cash rate is 4.35% and 10-year bonds have risen to a similar level – a very different scenario.
ASX All Industrials forward PER
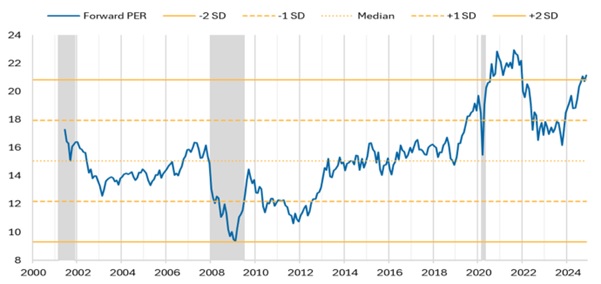
Past performance is not a reliable indicator of future performance. Source: Macquarie as at 13 November 2024
Another alarm bell rang in late 2024, heightening our levels of caution. The equity risk premium for the ASX200 hit historic lows.
ASX 200 equity risk premium vs 10yr bond yields
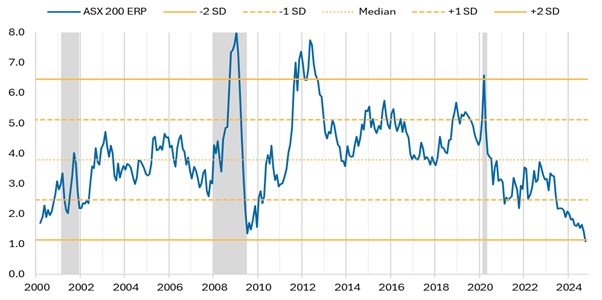
Past performance is not a reliable indicator of future performance. Source: Macquarie as at 13 November 2024
This has happened because while equity markets have been rising, bond rates have also been going up, which is unusual. The equity risk premium is the extra returns equity investors expect to receive for investing in a riskier asset class like equities, instead of less risky government bonds. Usually when the equity risk premium is very low it prompts investors to move capital away from equities to bonds, as equity returns aren’t seen to be worth the extra risk. This can prompt share markets to fall. This is yet to occur in the current cycle but based on history it looks like we are on borrowed time.
While markets are expensive, not all stocks are.
While markets currently look expensive and momentum has been strong, it doesn’t necessarily mean that stocks can’t keep going up. But, as the chart below shows, the more expensive markets are, the more likely it is that future returns will be below average, or even negative.
ASX 100 industrials – 3 year forward returns vs PE ratio
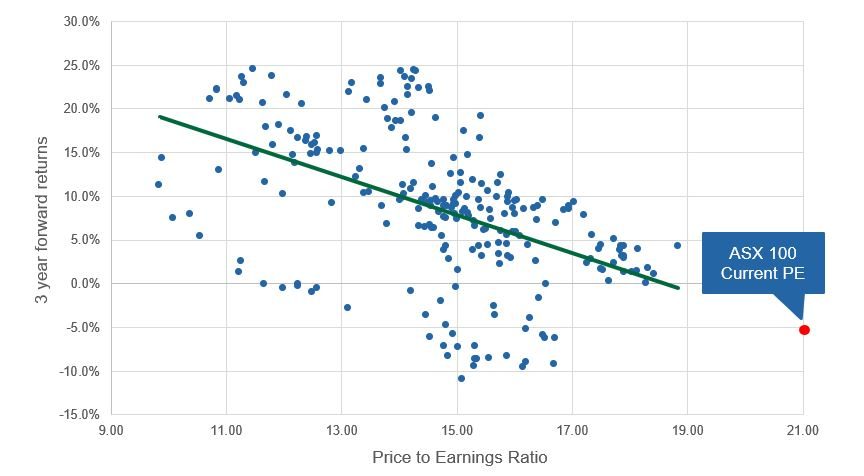
Past performance is not a reliable indicator of future performance. Source: Factset. Chart shows 3 year forward returns of the ASX 100 Industrials between March 2000 to November 2019
The current PE of the ASX 100 industrials is 21.2¹. While hypothetical, based on history this could indicate a low or negative return over the next three years. Current market valuations are reason for caution.
Despite market indices looking expensive as a whole, this is not true for all stocks. In fact, perversely we are uncovering a number of very well priced investment opportunities. The reason is the dispersion between high-priced stocks (based on earnings valuation) and low-priced stocks is extreme right now, as you can see in the chart below. For most of the past 15 years the valuation dispersion between stocks was relatively constant, but in 2019 the top quintile (the most expensive 20% of stocks) started breaking away from the pack. There was a massive discrepancy through 2021, but this closed sharply in 2022. Now the most expensive stocks are breaking away again. What makes this recent move particularly unusual is that bond yields are significantly higher today than they were in 2021.
ASX 200 median PE by quintile
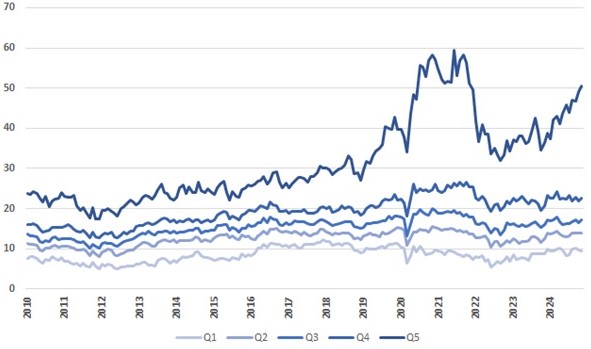
Source: UBS as at 29/11/24
An extreme example of how euphoric and price insensitive the market has become happened in early December, when the two founders of Pro Medicus sold $500 m worth of stock. The sell down was completed within an afternoon, at market (i.e. no discount to the last trading price) and on a PE multiple well in excess of 200 times. It is clear risk is not at the forefront of investors’ minds. Multiples in excess of 100x are not uncommon in the technology and software space and it seems any exposure to data centres means no valuation multiple is too high! This is despite the fact data centres are very capital intensive and the increasing competition for new sites is negatively impacting future returns.
In stark contrast, the stocks priced in the lower valuation bands are largely ignored, and many hidden gems are met with disinterest. There are several well-established companies, even a few global leaders, trading on PE multiples in the low double digits. Some of these businesses offer 30-40% potential upside in their share prices, while the downside risks should be low.
Amcor (AMC) is a good example. A global leader in packaging, it is currently in the process of merging with a major global competitor, Berry. The synergies of the merger are significant, in excess of $500m USD, which predominantly come from procurement savings as they gain better buying power for raw materials. Based on Amcor’s track record of acquisitions, and our analysis, the numbers look conservative and if these synergies are realised the company would be trading on a mere 10x earnings.
Looking down the market cap spectrum, in the REIT sector, little-known Charter Hall Retail REIT (CQR) owns a $3 bn portfolio of convenience retail assets. These assets are typically backed by major anchor tenants like Woolworths and Coles, which usually represent 50% of the rent of each asset, and have historically grown at 2.5-3.0% p.a. through the cycle. It is an incredibly resilient rental stream with occupancy levels barely moving even in tough economic times. The Charter Hall Retail REIT currently trades on 12x earnings and a forecast yield of 8% based on current interest rates, but with upside if rates were to get cut in 2025.
There are several other opportunities such as Viva Energy (VEA) or Orica (ORI), a global leader in explosives, that are good businesses, with enduring competitive advantages and good prospects for growth but aren’t currently catching the eye of the market which is fixated on other themes.
Warning signs are flashing, but nobody knows when things will turn.
None of the factors we have mentioned in this article mean that markets are due for an imminent fall, nor would we ever advocate trying to time the market. However it’s clearly becoming riskier to own expensive, growth stocks. When markets turn it’s often expensive growth-focused stocks, particularly those that are lower quality or more speculative, that are hit hardest. Quality stocks at reasonable valuations tend to hold up better. In a recent survey² from our parent company, Natixis Investment Managers, more than three quarters of institutional investors said they think that 2025 is likely to be the year that valuations matter .
When you stretch a rubber band out you never know exactly when it will snap, you just know that when it does it will snap back hard.
This article has been published with permission from its author, Dan Moore from Investors Mutual
¹ As of 30 November, 2024
² Natixis Investment Managers Global Survey of Institutional Investors, conducted by CoreData Research in October and November 2024.
This publication (the material) has been prepared and distributed by Natixis Investment Managers Australia Pty Limited ABN 60 088 786 289 AFSL 246830 and includes information provided by third parties, including Investors Mutual Limited (“IML”) AFSL 229988. Although Natixis Investment Managers Australia Pty Limited believe that the material is correct, no warranty of accuracy, reliability or completeness is given, including for information provided by third party, except for liability under statute which cannot be excluded. The material is for general information only and does not take into account your personal objectives, financial situation or needs. You should consider, and consult with your professional adviser, whether the information is suitable for your circumstances. Past investment performance is not a reliable indicator of future investment performance and that no guarantee of performance, the return of capital or a particular rate of return is provided. You should consider the information contained in the Product Disclosure Statement in conjunction with the Target Market Determination, available at www.iml.com.au. It may not be reproduced, distributed or published, in whole or in part, without the prior written consent of Natixis Investment Managers Australia Pty Limited and IML. Statements of opinion are those of IML unless otherwise attributed. Except where specifically attributed to another source, all figures are based on IML research and analysis. Any investment metrics such as prospective P/E ratios and earnings forecasts referred to in this presentation constitute estimates which have been calculated by IML’s investment team based on IML’s investment processes and research. The fact that shares in a particular company may have been mentioned should not be interpreted as a recommendation to either buy, sell or hold that stock. Any commentary about specific securities is within the context of the investment strategy for the given portfolio.
