Raymond Dalio (born August 8, 1949) is an American billionaire investor, hedge fund manager, and philanthropist.[3] Dalio is the founder of investment firm Bridgewater Associates, one of the world's largest hedge funds.[4] Bloomberg ranked him as the world's 58th wealthiest person in June 2019.[5]
What Ray Dalio says matters. For further perspective we know that successful Australian global investor, Hamish Douglas (Magellan Financial Group) seeks Ray Dalio's views on a regular basis.
Ray Dalio has been involved with China for decades. He assisted China estabilsh their stock market. In this video he discusses the current trade tensions between China and the US and sees them as a natural development.
He also puts the rise of China in perspective by comparing it against the rise of the UK and US in history.
Ray Dalio believes that the biggest risk for investors is not having exposure to the Chinese economy.
Transcript
Jim Haskel:
I'm Jim Haskel, senior portfolio strategist. I'm here with co-CIO Ray Dalio and the subject today is China. And Ray, you've been going there since 1984, a lot of experience, China in the news today in many different regards. Can you walk us through a little bit about your experiences and how you've seen China evolve over the last 35 years?
Ray Dalio:
I've been able to go to China since 1984 and participate and see the evolution. Yeah, and it's been quite something. The first time I went, I was invited by CITIC, which was called a window company then, which was the only company that was allowed to deal with the outside world, and they were curious about the world financial markets. I was invited there.
At the time, the city was mostly Hutongs, which are small neighbourhoods, poor neighbourhoods. I remember speaking in their office building, called the Chocolate Building, and looking outside, and we were talking about opening up. And at the time, I knew what opening up would mean. The rest of the world had a cost and level that was here and China had a cost level there, and if they could eliminate their inefficiencies, it would go like this.
And so, I looked out there and I said, "You'll see those Hutongs become replaced by skyscrapers and so on." And they told me, "You don't know China," but that force and their character and the creativity that they exhibited took them to what is the greatest economic miracle of all time.
To put that in perspective, per capita income since then increased by 26 times. The share of world GDP went from 2% to 22% today, so it's a comparable power of the United States. The poverty rate went from 88% to less than 1%. And the life expectancy increased by 10 years. There're many, many others, and capital markets, very big changes.
But I never went for making money, I went for curiosity, you know? And that curiosity brought me in contact with the Chinese people who I really, really came to love and admire. The character of them, what type of relationships that they value, all of those types of things.
And I could see that character, and I was able to, over those years, build friendships, I was able to contribute in some small ways to the development of the financial markets and see it. And I remember these people, I have a great old group of friends who were the first pioneers to set up the stock market there.
There were seven companies, each had a representative, and it was in a dingy hotel, and these people were to form the stock market and the financial markets, and so evolved, and that evolution was an intimate evolution in which I brought my family, I brought my kids.
I remember bringing my son, Matthew, when he was very young, along and we would go in, and we'd have meetings, and they'd bring cookies and milk, and he'd be there, and he ended up going to school there when he was 11. It was a whole different world. He lived there.
And that whole different world, just to give you an idea of technology, you know where they are in technology now, which is comparable in many ways to the United States, when I went, I would bring them, as gifts, $10 calculators that they thought were miraculous.
I've gotten to know the people. I go there because I like and admire the people, and I've done that for 20 years or more before we ever did anything commercially.
Jim Haskel:
And so, we're sitting in a time now where China has evolved in a big way, and I wonder, just from your perspective, as an American who's gone to China for years and years and years, how do you make sense of this growing conflict that you've written a lot about between China and the United States? What do you think is the root cause of that?
Well, it makes total sense in a historical context. You know, I've been studying economic history, I used to study what the last 100 years is, and recently, because I wanted to study the rises and declines of reserve currencies, I've studied the last 500 years carefully, and I've looked at the last thousand years.
What I've seen over and over again is that when there's a rising power challenging an existing world power, that there is going to be a conflict. There's a global order, world order, and the way that usually happens is there's a conflict and there's a war quite often, and then after the war, whoever wins the war gets to set what the global world order is.
And then you have a period of peace because no country wants to fight that country until there's a rising power challenging an existing power again. That's happened 16 times in the last 500 years, and in 12 of those times, there's been wars, and sometimes you get around them. I'm not saying this is going to be a war, but I think it's a natural development in terms of China growing, expanding.
We have a small world and it's a big country, and we're going to bump into each other, and so it's that natural conflict. And then the question is how it's best dealt with, but I think just a natural evolutionary step.
Jim Haskel:
And you've sort of put the framework around this where trade is just the symptom of this broader conflict, whereas trade is always in the financial news, but it's really just one symptom. There's also military posturing, there's other elements of this whole conflict.
Ray Dalio
Sure. History has shown us that there's this pattern. I'll describe the pattern. We're now living in a US dollar reserve currency world, so I want to look at the US dollar and the US empire. Before that, I wanted to look at the UK and the British empire, and then before that, I wanted to look at the Dutch empire, and I wanted to follow them in their various dimensions.
I read all of those stories. I looked through the numbers and I read the stories, and I could see that the stories would repeat, the same basic stories. The charts on this page show six major measurements of power.
- The first is technology and education.
- Second is output, how strong the economy is.
- Third is trade.
- Fourth is military.
- The fifth is the strength of the financial centre.
- And the sixth is reserve status.
What we did is to stitch together a whole bunch of statistics so that we could measure each one of those. And so, they go back to 1500 and you could watch the cycle repeat over and over again.
This next chart shows the averages of these rises and declines by each of the factors, and I think they tell the story pretty well as to what a classic rise and decline of the empires and reserves currency status is. For example, the Dutch, back in the 1600s, late 1500s and early 1600s, invented ships that could go all around the world.
And because Europe fought a lot, they put arms on the ships, and then they could go all around the world, and the world was their oyster. They could bring back great things. And they then increased their share of world trade to be 50% of world trade.
And when they went global, typically through their businesses, Dutch East India Trading Company, they had to be enabled with military to protect their trade routes, and they developed financial empires.
As a result, we saw not only trade grow, we saw the military grow, we saw them carry their reserve currencies around, and because they were used so commonly, they became world currencies and that's what made them world reserve currencies.
And as a result, they also developed financial centres because they developed capital markets, money came from around the world to invest through those capital markets in those currencies in those businesses that were their businesses and other businesses, so they developed financial centre. Amsterdam was the centre of world cap financial markets as a result of that.
And as a result, they built their trade and their commerce together. They quite often, then, over a period of time, there were forces that led to their decline, and those forces were typically a combination of higher levels of indebtedness, others gaining competitive advantage.
For example, the Dutch ship builders were hired by the English to learn how to build great ships that would carry them around the world, and there was a change in technology, and there was really not much of a difference between the businesses, the technologies, and the governments in terms of making those things happen.
For example, the British East India Trading Company had a military that was twice the size of the British military, and they were the ones that conquered India and so on. I just put together the averages of those forces so that you could just see, let's say, the average power, and it goes back to 1500.
And you could see the blue line is the United States, and you could see its rise and then its relative decline, and you could see the emergence of China to be almost a comparable power.
You look at the red line over a period of time and you could see going back to 1500 that China was always one of the highest, most powerful country, or one of the most powerful countries, until they had the decline from about the 1800 period, but you could see that emergence. And so, to me, this is all very classic.
Jim Haskel:
Now, if you bring this back to the current conflict between the United States and China, I think what's so interesting is that you also believe that global investors must look at China and explicitly start to consider whether China should be part of their portfolios. And so, it seems kind of interesting. We're talking about an emerging conflict, but we're also simultaneously talking about there's really some merit for China to be a component of a global portfolio. Give us your perspective on that and why.
Ray Dalio
Think about it.
Would you have not want to invested with the Dutch in the Dutch empire?
Would you have not wanted to invested in the Industrial Revolution and the British empire?
Would you have not wanted to invested in the United States and the United State empire?
I think it's comparable. Would you not want to invest in those places? And look at the growth in the markets. Over the last 10 years, the stock markets in China has increased, market capitalization, by a factor of four. The bond markets, combining both the government and the corporate bond markets, have increased by a factor of seven. And they're each the second largest markets in the world.
And I've had plenty of contact with those markets and with those people, the regulators and so on behind them, and I have a lot of admiration for that. I also believe in diversification. Yeah, I believe that China's a competitor of the United States, or Chinese businesses with be competitors of American businesses and other businesses around the world, and that you're going to therefore, you want to be, if you're diversified, having bets on both horses in the race.
And then I think, from investing over the years, I've been doing this for a long enough period of time to know that there's a tendency of bias not to do the new things. When I first started, we were at the end of an era where pension funds invested mostly in bonds.
Okay, then they thought it was bold to go to equities, then they thought it was bold to go to international equities, a lot of people argued against going to global equities, and so on. Emerging market equities, and emerging markets, all of that was considered to be bold.
And so, the thing that people haven't yet done, seems like the big risky thing, where, in my opinion, going where the growth is and also having the diversification is a smart thing to do.
Jim Haskel:
When you consider the merits of that, even if you agree with what you're saying, is now the time when the trade part of the conflict may be getting even more serious because we're moving from tariffs into things like supply disruptions, and export interruptions, and prevention of particular exports? Is timing an issue, or do you ignore that completely?
Ray Dalio:
Well, the markets, as you know, are always discounting timing, right? If you have a new, good thing happens and the markets rally, if you have a bad thing that happens and the markets sell off, and so the markets kind of reflect, broadly speaking, the ebbs and flows and the good and the bad.
And so, if you wait for everything to be crystal clear, everything's going to be terrific, you'll pay a higher price than if you don't. I think the real question is, are we going to go to war? If we go to war, then we're in a different world.
I don't think we're going to go to classic war, I do think there's going to be a restructuring of the world order in terms of changes in supply chains, there'll be changes in who's making what technologies, important changes and sort of those things. But I don't think that that's going to mean that there won't be the evolution of China, the evolution of the United States, and I think that that diversification is good.
Yes, I would say that now is the time. The reason now, now is the time that it's opening up. Now, you could be early or you can be late. I think that it's better to be early because, as you know, the inclusion and the MSCI indexes and other such things are meaning that they're opening up, and that will accelerate, those percentages will keep rising.
And so, do you want to be early or do you want to be late? It's better to be early that it is to be late. And I think, also, it's a time for diversification.
Jim Haskel:
Right. Investing in China can be a risky thing to global investors, that's the way they perceive it. How do you think about that relative to the other risks they're already carrying in their portfolios?
Ray Dalio:
I think that every place is risky. We're talking about relative risk, okay?
I think Europe is very risky. When monetary policy is almost out of gas, and we have political fragmentation, and they're not participating in the technology revolution, and I can go on and on as to why I think Europe is very risky.
I think the United States is very risky in its own ways, having to do with the combination of the wealth gap, the political system, the conflict between socialism and capitalism that'll be part of our election, the fragmented decision making, so many different things, and the absence of the effectiveness of monetary policy.
I think emerging markets, in their own ways, have their own distinct risks, and I think that China has its own particular, distinct risks, which are all different. When I look at it, I think that it's less, or no more, risky in the totality than other markets, and I think what is most risky is not to have a good diversification of those markets.
In addition, the Chinese have more ability to deal with monetary and fiscal policy relative to the United States. I'm not saying everything's a plus, there're pluses and minuses. But as you know, one of my big concerns, and I've got a number of big concerns about the United States and some of the issues that are facing the western economies, and among those are the inability of central banks to be as effective when interest rates get to zero and quantitative policies, quantitative, monetary easing is not as effective.
Let me pause on that and touch on that. If you look at the difference in interest rates to zero and the capacity of fiscal policy to be coordinated, they have a lot more room to be managing those things, and they are managing. I mean, I don't know how long I've heard everybody say, "Okay, the debt problem is going to be a problem there," and so on.
Again, I'd suggest you read the dynamics of my book about the nature of debt and what countries can do when the debt is in their own currency. I also think that not investing in China is very risky. I mean, think about it. Here we are in the early part of 21st century and there's this emergence of China. Do you really want to make the decision not to invest in China and not to be there in the future?
Look, I believe every place is risky. I'm very risk-focused. I tend to see things that are going to go wrong. I have an inclination to do that. I think every place is risky, which is why I like the notion of diversification. I just want people to see China objectively.
I know, over this past number of years, that I have been very pro-China, very bullish on China, in its various ways, and people say, "Why are you so bullish on China?" And I know it's very controversial to be, particularly in this time, to be very bullish on China.
I just want to let you know that I'm sincere. Okay? I've been there. Because I hope you know by now that my main objective is to be as accurate as I possibly can. Yeah, I really admire what is being done, and I want to be a part of it, and I think our investors should be a part of it.
Jim Haskel:
I want to ask you about the best way to actually invest in China. What we see is that most of the portfolio flows go to either the private equity markets or the public equity markets, and that's a little countered to your framework of how you invest across time and throughout the world. How would you think about best approaching the Chinese markets as a new investor?
Ray Dalio:
Well, I wouldn't think of it as being any different than in any other place. Public markets and the liquid markets are going to allow all the advantages that they allow, and the private markets are going to allow all the advantages that they allow.
The public markets are going to provide the liquidity, the diversity, the ability to move positions around and rebalance and so on, which is very important to us. And then the private markets, let's say the venture markets, expose one to the new technologies and the energy that's happening in terms of entrepreneurship and young technologies there, and I think that's important.
I think there's an awful lot of money that is chasing those venture capital investments, and then I think there's a whole lot of opportunity. I would say it's a reflection, really, of how that country has changed. Wow. From my $10 calculator days, to see what the mind-blowing technologies are.
To put that in perspective, they're now the number one country in fintech, number three in AI and machine learning, number two in wearables, number two in virtual reality, number two in educational technology, number two in autonomous driving, and they are wanting fast to be number one in those industries.
They now account for 34% of unicorns in the world, by comparison the 47% in the United States and only 19% in the rest of the world. And in terms of ... That's when they start as unicorns. If they take the share of unicorn value, it's 43% versus 45% in the United States and only 12% in the rest of the world.
If you're looking at venture, I think you've got to be there, so I think it would be important not to miss out on those. As far as the public equity situation, it's analogous. You could see the market capitalization accelerating in the stock, bond, corporate bond markets, all of their instruments, and you could see the foreign flows coming in at an accelerating pace.
You can expect those markets to be bigger than the markets that we have anywhere in the world with time, and they will serve a similar purpose. As far as, let's say, the legal regulatory system, it's advanced, but it hasn't advanced as much as some of the developed countries, but it is more advanced and developing at a fast rate than most of the emerging countries.
And if you deal with the question of whether it's a more autocratic system and whether you prefer a more autocratic leadership system than a democratic leadership system, you'll have to make that choice for yourself. Don't look at it as some unique place in terms of some of those impediments, look at the whole picture.
I would say that the Chinese or Confucian way of approaching things has a lot to be said for it, so you have to make your own choices.
Jim Haskel:
Let's get back a little bit to some of the questions that investors have. For example, should they think of China as an emerging market investment, should they think of it as a developed market investment, somewhere in between, in terms of the expected return, risk, correlation of that investment? You talked a little bit before about diversification, but what about the expected return and risk of an investment in China, and how would you structure that?
Ray Dalio:
When you asked me the question of is it more like an emerging country or more like a developed country, so many different aspects of what defines an emerging country or a developed country's market vary.
So what is the size of the market capitalization? What is the legal form? What are property rights? Just so many different dimensions, but I would make as a generalisation that China is somewhere between 60 or 70% more like an emerging country, 60 or 70% more like an emerging country in those respects than it is like a fully developed country.
It doesn't have a regulatory system that is as developed as the developed countries that have been at it a while, it doesn't have some things. It has market capitalization, it has liquidity, and that's a two-edged sword. It has also greater levels of inefficiency. The greater levels of inefficiency provide investment opportunity. As a generalisation, I would describe it that way.
If I'm looking at it instead in the question of expected returns and risks, I think, as you know, I look at each market and I look at the return relative to the risk, the expected return relative to the expected risk, and the past return relative to the expected risk and what drives it.
By and large, I find developed markets and emerging markets roughly comparable, and that being able to put together portfolios of those in an effective way is the way to engineer that portfolio.
When I look at China, I think that the expected return relative to the expected risk will be equal to or perhaps higher than elsewhere, partially because of the fact that there's the diversification that you could have and put together well.
But also partially because of the greater capacity of the central banks, the central bank, I should say, in being able to ease monetary policy and also run fiscal policy to be able to have a higher ratio. I think that that would be a plus.
Jim Haskel:
You've traced the arc over the last 35 or so years of Chinese history and described the evolution, if you look now forward five, 10, 15 years, what do you think the highest probability, what will we be looking at when we look at China's evolution?
Ray Dalio:
We'll be looking at a very different world, and we'll be looking at a very different China, and we'll be looking at a very different United States in five, 10, 15 years. In some ways that we will never be able today to anticipate, and in some ways that are inevitable in kind of the same sort of way that demographics is inevitable.
The following charts probably help to answer your question. They show a number of statistics, including the sizes of the economies, the relative sizes of the economies, the relative shares of world trade, the shares of the global market equity market capitalization, the shares of the global debt market capitalization over the next number of years.
These projections are based on our 10 year forecast that look at a lot of indicators to determine what the next 10 years growth rate is going to be, likely to be. They're based on the relationships between those types of growth rates and changes in market capitalization, and also work that's now being done to develop the market capitalization and open those economies.
They're not going to be exactly accurate, but they're going to be probably pretty much accurate. In a nutshell, it's going to have the largest economy in the world, the most trade in the world, the most market capitalization in the world.
Jim Haskel:
Those are big changes.
Ray Dalio:
Yeah. And the United States, and Europe, and Japan, and emerging countries are going to have big changes, too.
Jim Haskel:
You're sketching out a continuation of some dramatic trends that have already taken place. Any threats that you see to that progress going forward?
Ray Dalio:
Well, I mean there're always threats. I think the threat is the threat of conflict with the United States in whatever form that'll be. And then, there are always threats. They have to do with probabilistic things. You can have threats that'll affect our countries in terms of anything from climate change issues, pandemics, political disruptions. There's that whole range that can affect any of those countries.
Jim Haskel:
Ray, we've covered a lot. We've talked about the evolution of China, the opening of the capital markets, how to think about it from an investment point of view. I thank you for your time and perspective, and I look forward to sitting down once again and updating this in the not too distant future.
Ray Dalio:
It's my pleasure. It'll always be interesting.
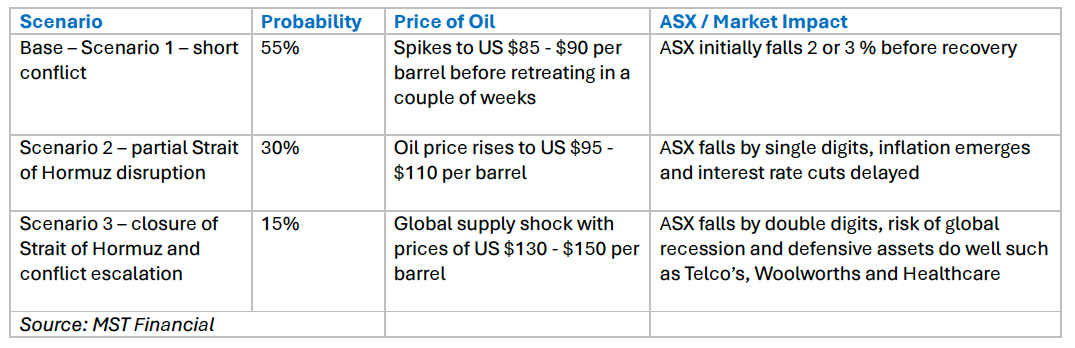
 Over the weekend, tensions between the US, Israel and Iran escalated significantly following a coordinated strike by the US and Israel, which took out much of the Iranian leadership including the Supreme Leader.
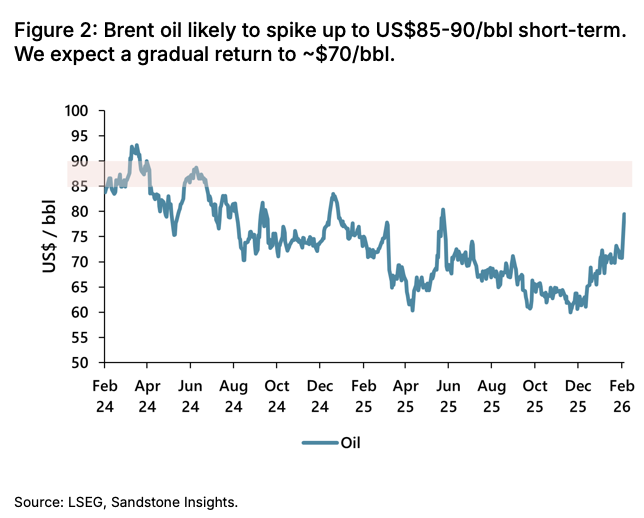


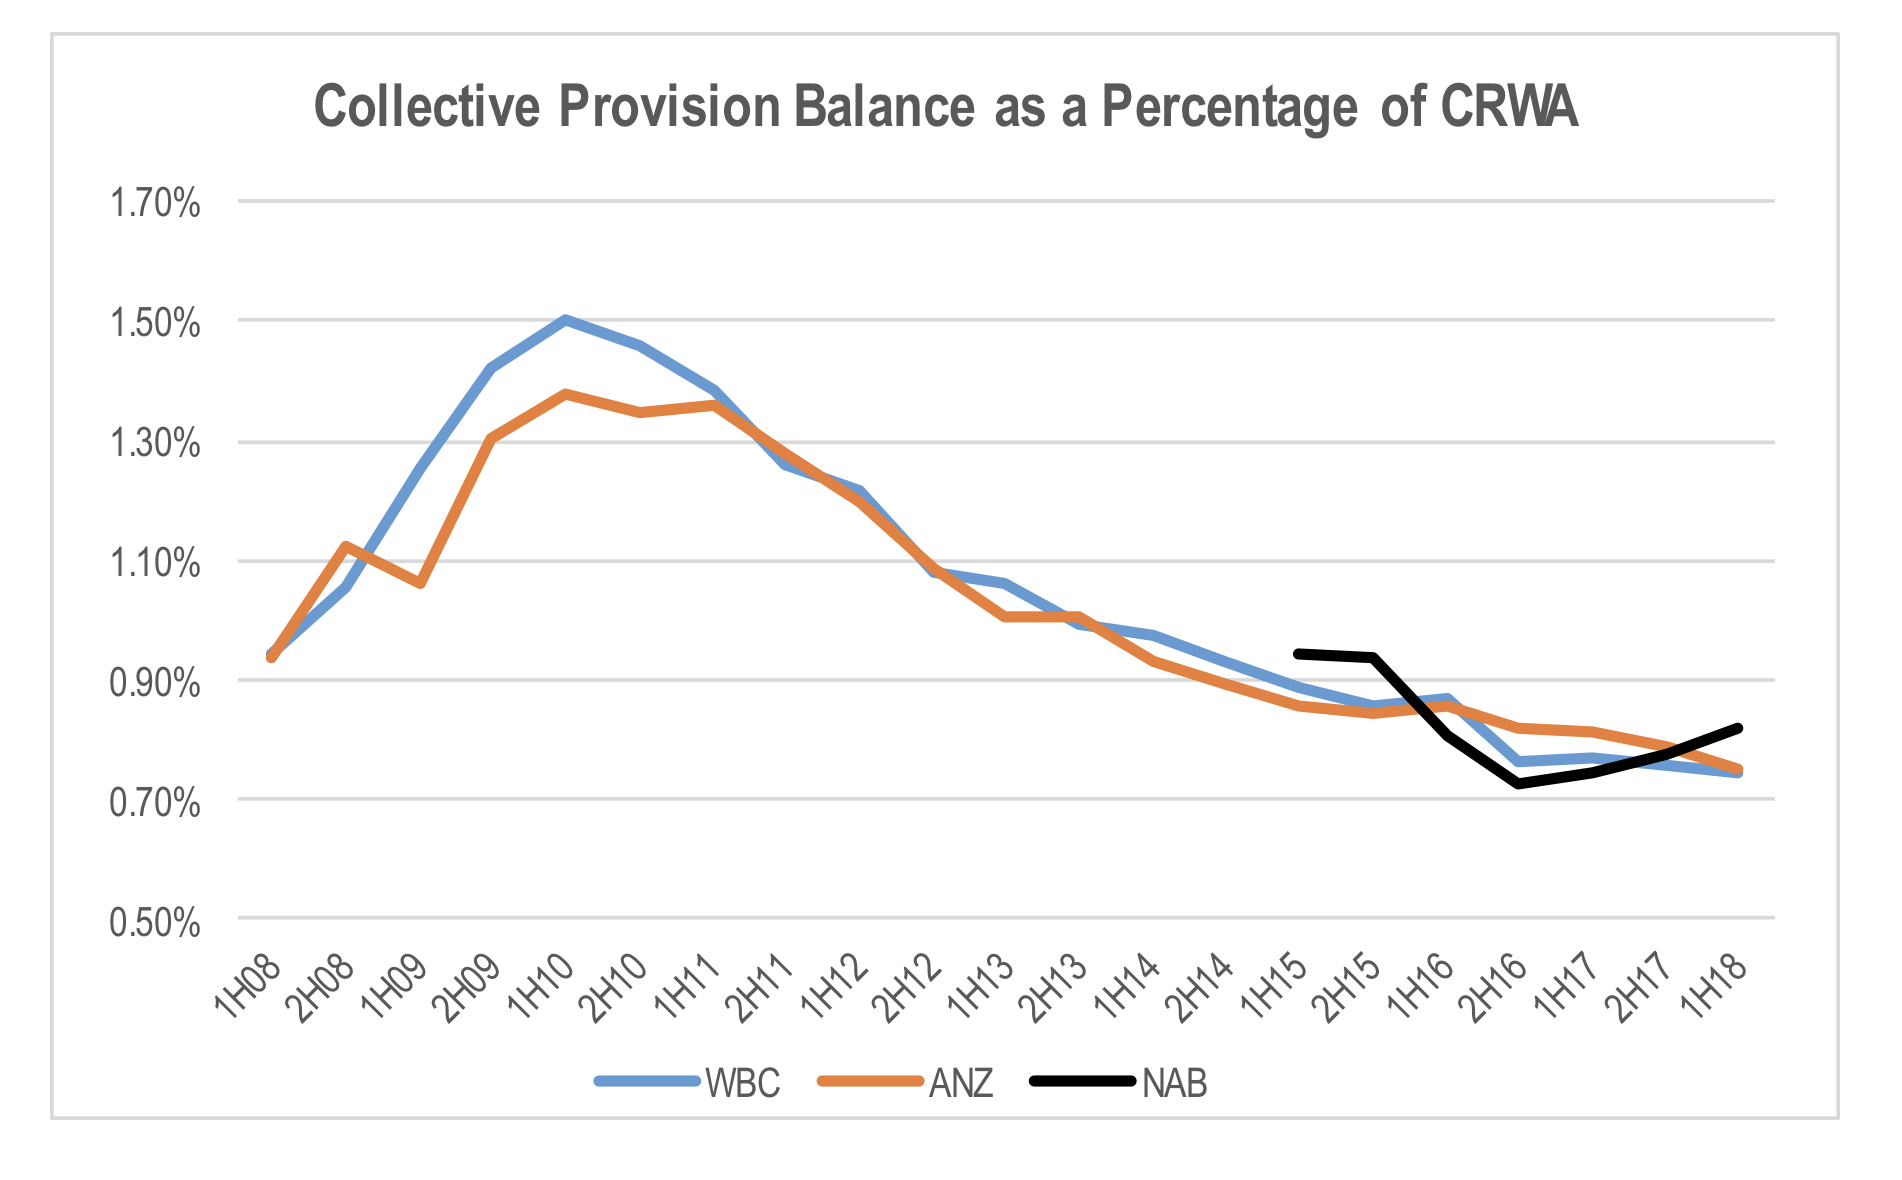
 Westpac, NAB and ANZ have reported their annual results for the year ending 30th September 2024 and they all show that profit margins are under pressure and, despite nominal bad debts, profit growth remains elusive. How then to explain the record valuations of this group, not to mention CBA which is the most expensive bank in the world.
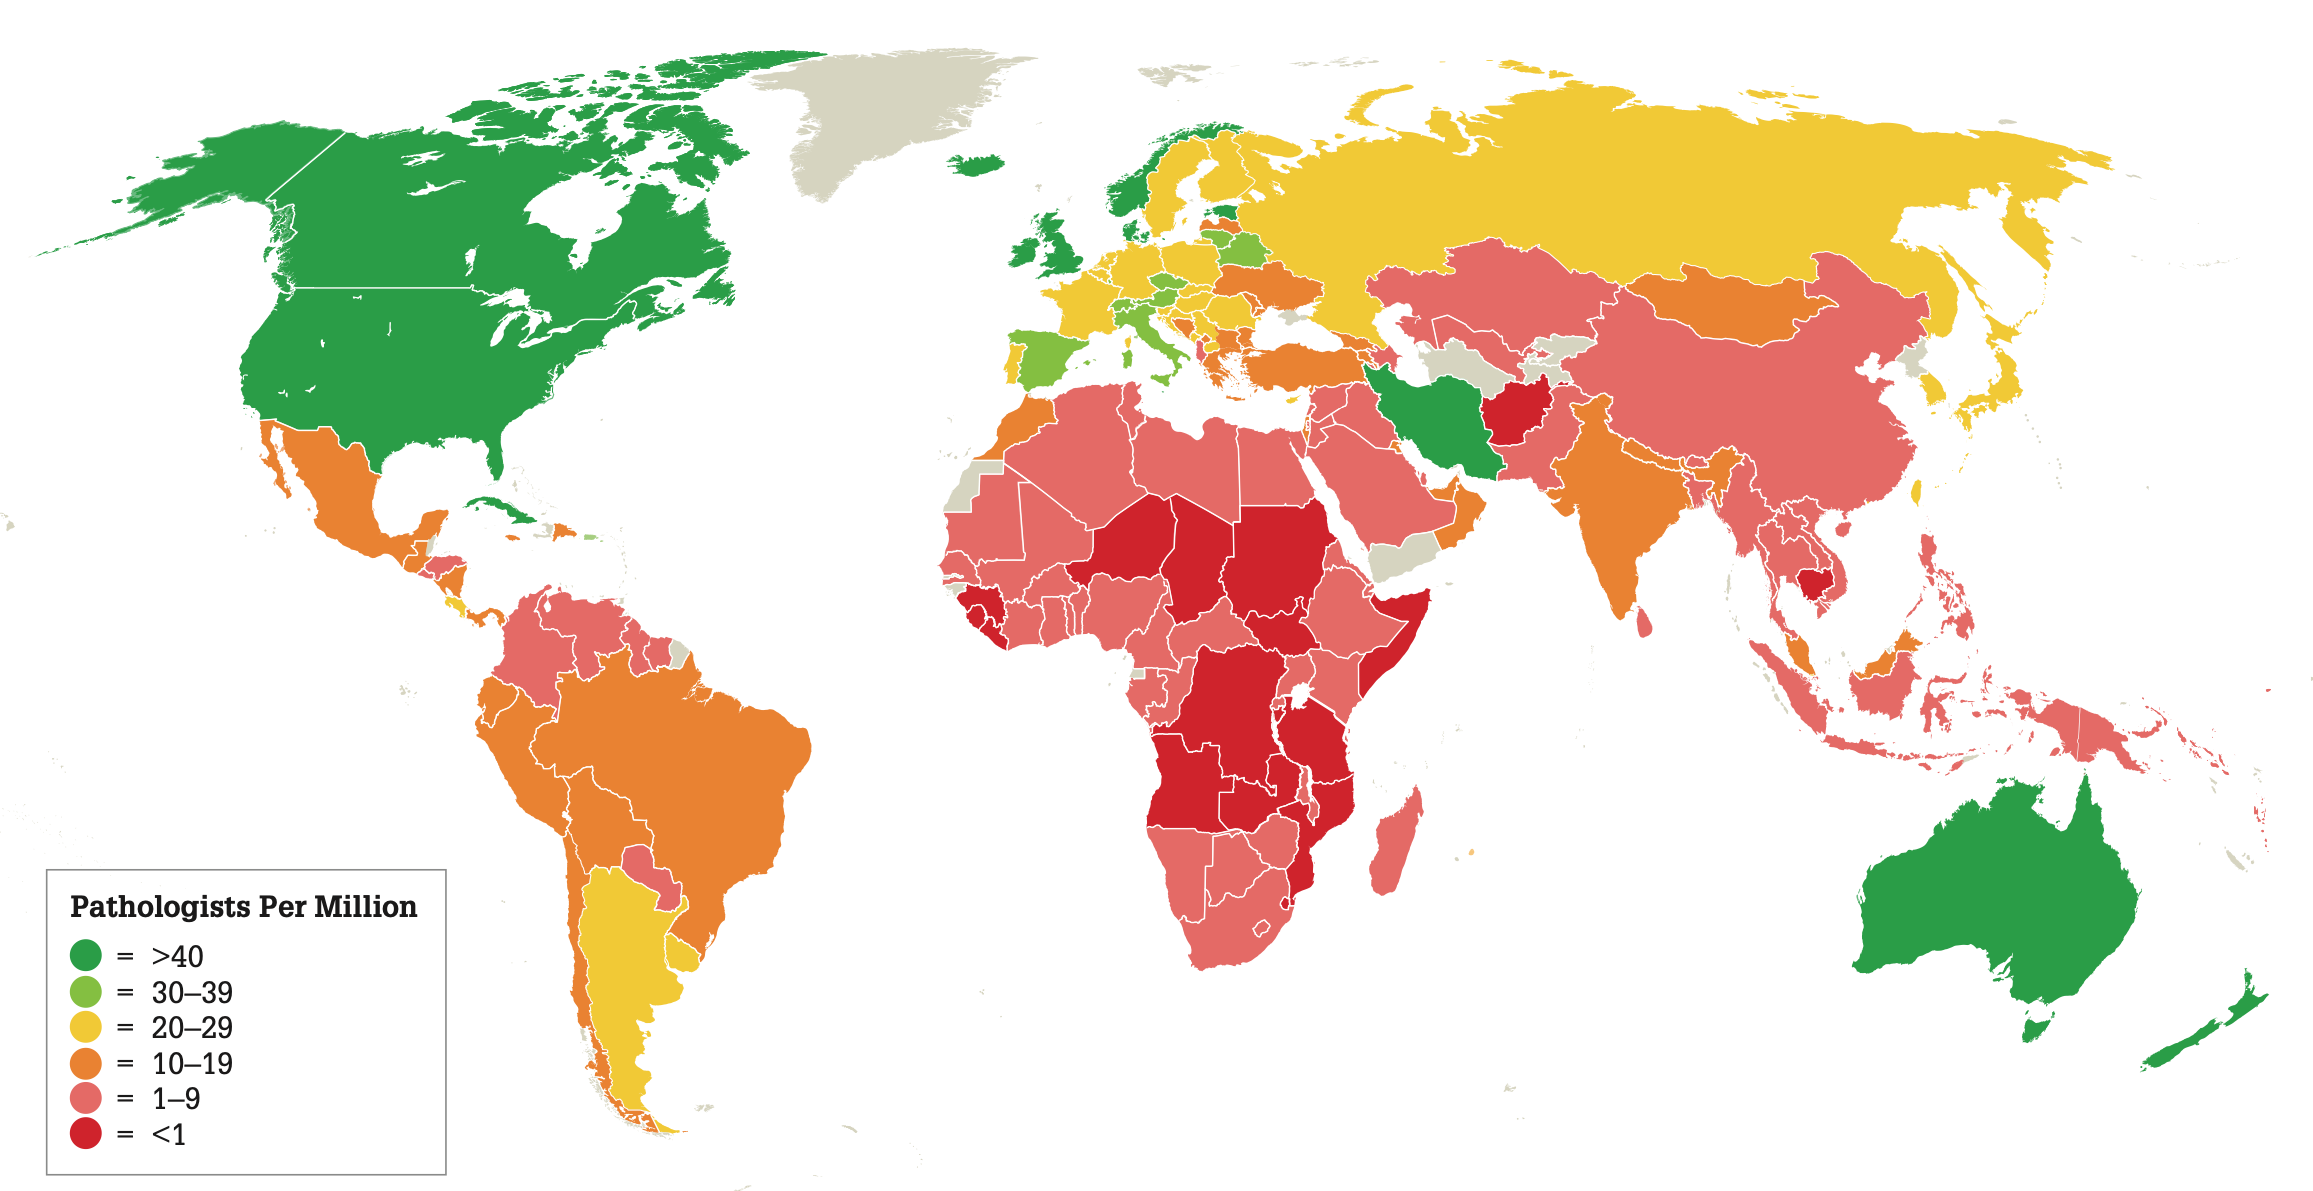

 The current share prices of all 3 Australian listed pathology companies are below pre-COVID levels. In Sonic’s case, this is despite earnings per share in financial year 2023 being 19% higher than that in the 2019 financial year. Investors should ask themselves whether this represents a buying opportunity.


 Investors in Asia have endured a difficult few years. The combination of China’s COVID zero policy together with it’s crackdown on property developers, regulation of the tech sector and increased geopolitical tension with the West have made investment returns hard to come by.
 Warren Buffett’s two golden rules for investing are, 1. Don’t lose money 2. Never forget rule one.


 Mark Draper (GEM Capital) writes a monthly column for the Australian Financial Review. In his January 2019 article he outlines some of the triggers investors should look for that provide clues for when to sell.


 This article was written by Mark Draper and appeared in the Financial Review in the month of July 2018.


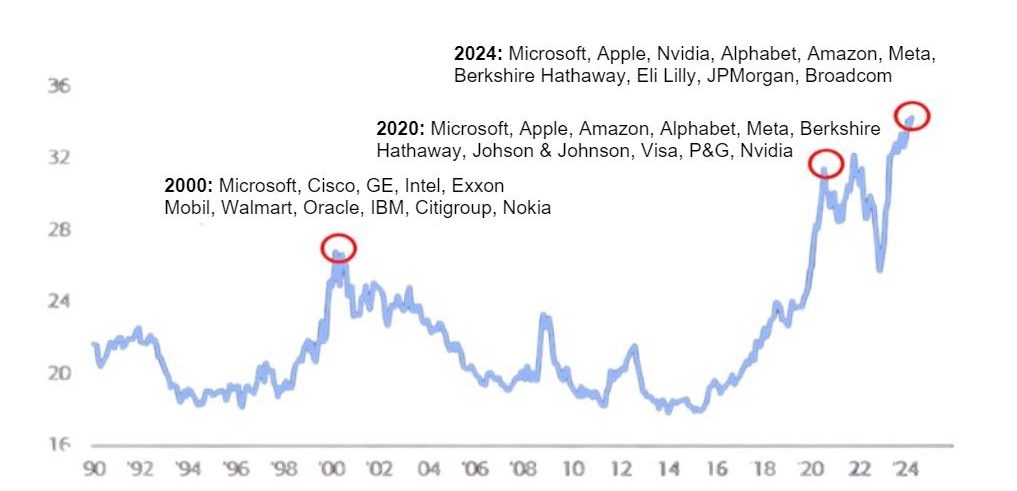
 Every bull market has it's pin up boy. In the early 2000's, it was the technology stocks where we witnessed companies 'reinventing' themselves by adding .com to their name, accompanied by large share prices increases.


 The study used an eye-tracking device to ensure that all information included in the management report was read and considered in light of judgment formation.


 Apple is among the largest companies in the world. The company enjoys strong brand recognition globally and extensive market penetration for its flagship products, most notably the iphone. While speculation around the success of Apple Watch, Apple TV, iPad, or even the likelihood of an Apple Car often captures headlines, we estimate that iPhone and iPhone related services represented around 70% of Apple's revenue and 80% of Apple's gross margin in 2016. Despite its relatively high price, there is strong demand for the iPhone in both developed and emerging markets, with China now contributing 21% of Apple's total revenue.


 With the avalanche of new listings coming to market, we consider the issue should investors participate in IPO’s (Initial Public Offers)?
 Bank's fail because they are 1) illiquid 2) insolvent or 3) both.
 GEM Capital has considered applying for stock in the soon to be listed Inghams IPO, and had the opportunity through its investment bank contacts, but have decided not to proceed after careful consideration.


 The present decade has been a tumultuous one for Europe. More than a handful of countries in the European Union went through a sovereign debt crisis in the aftermath of the 2008-09 global financial crisis and, at least for now, fiscal austerity and unprecedented monetary expansion continue to sit side by side as the twin pillars of economic policy.
 No new technology since the dawn of the internet has captured the imagination like blockchain.
 - How Amazon is changing the way we shop


 China’s extraordinary economic growth of recent decades has been driven by the mass mobilisation of rural labour, huge capital investment, low-cost manufacturing exports and the acquisition of foreign technology. However, in recent years, a number of imbalances have been developing that pose risks to the country’s stability. Since the GFC, China has experienced an unprecedented expansion of credit, from around 140% of GDP in 2008 to over 200% of GDP in 2014. Meanwhile, it has experienced a property construction boom that has shifted its housing market from structural undersupply to oversupply, with millions of properties now lying vacant.