Key points
> A housing recovery has been a necessary aspect of rebalancing the economy through the mining bust.
> While Australian property prices are overvalued, this should not be a constraint on the RBA. Expect another rate cut in May with the possibility of more to follow.
>The medium term return outlook for residential property is likely to be constrained.
Introduction
The case for the RBA resuming interest rate cuts this year has been fairly clear: commodity prices have fallen more than expected; the $A has remained relatively high; while residential construction and consumer spending are okay the outlook for business investment has deteriorated pointing to overall growth remaining sub-par; and inflation is low. This has seen the cash rate fall to 2.25%. While the RBA left rates on hold at its April meeting, it retains an easing bias pointing to further cuts ahead.
However, the main argument against further rate cuts has been that the housing market is too hot and further rate cuts risk pushing home prices to more unsustainable levels resulting in a more damaging eventual collapse. But how real is this concern?
Housing construction doing its part…
Economic upswings in Australia rarely start without a housing upswing. Lower interest rates drive housing demand resulting in higher house prices which boosts consumer spending via wealth effects and drives home building. The latter is happening with approvals to build new homes at record levels.
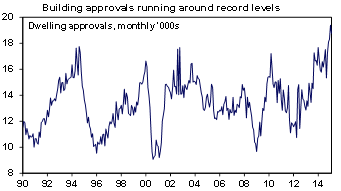
Source: Bloomberg, AMP Capital
…but what about overheated property prices?
But the big debate has been whether low rates are just fuelling an overheated property market. Its long been known that Australian housing is expensive and overvalued.
- Real house prices have been running well above trend since the early 1990s and are now 14% above it.
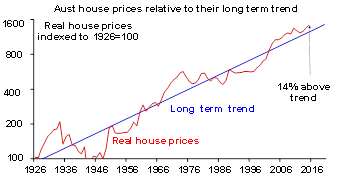
Source: ABS, AMP Capital
- According to the 2015 Demographia Housing Affordability Survey the median multiple of house prices to household income in Australia is 6.4 times versus 3.6 in the US and 4.7 in the UK. In Sydney its 9.8 and 8.7 in Melbourne.
- The ratios of house prices to incomes and to rents are at the high end of comparable countries in the OECD.
While it's generally agreed Australian property prices are high, the reasons for it are subject to much debate with many looking for scapegoats in the form of negative gearing and buying by foreigners and SMSF funds. However, these don't really stack up: negative gearing has been around for a long time and while foreign and SMSF buying has played a role it looks to be small and foreign buying is concentrated in certain areas.
The shift to low interest rates since the early 1990s has clearly played a role. Consistent with this, the rise in price levels from below to above trend has gone hand in hand with increased household debt. The trouble is that other countries have lower levels of interest rates and most have lower household debt to income ratios and house price to income ratios. A more fundamental factor is constrained supply. Vacancy rates remain low and there has been a cumulative supply shortfall since 2001 of more than 200,000 dwellings. The main reason behind the slow supply response appears to be tough land use regulations in Australia compared to other countries.
High house prices compared to rents and incomes combined with relatively high household debt to income ratios suggest Australia is vulnerable on this front should something threaten the ability of households to service their mortgages. While this vulnerability has been around since the house price boom that ran into 2003 – with numerous failed predictions of property crashes! – the RBA is right to be concerned not to further inflate the property market. The renewed strength in auction clearance rates this year to record levels in Sydney is a concern.
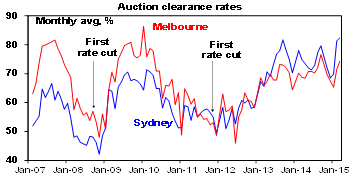
Source: Australian Property Monitors, AMP Capital
However, there are some offsetting factors. First, home price gains are now narrowly focussed on Sydney. According to CoreLogic RP Data Sydney home prices rose 13.9% over the year to March. But growth across the other capital cities ranged from 5.6% in Melbourne to -0.8% in Darwin with an average of just 1.5%. So, the rest of the Australia is hardly strong.
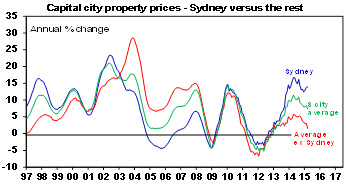
Source: CoreLogic RP Data, AMP Capital
Second, growth in housing debt is running well below the pace seen last decade, and there are some signs of a loss of momentum in the last few months.Investor debt is up 10.1% year on year but reached around 30% through 2003 and in the last few months has slowed to an annualised pace of 9.3%.
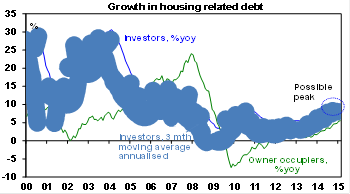
Source: RBA, AMP Capital
Finally, the RBA and APRA have pushed down the macro prudential path to contain risks around housing.Tougher APRA expectations of banks were announced in December with the threat of sanctions if these expectations are not met.
So while the RBA is right to be mindful of the impact of low interest rates on the property market, the concentration of the property market strength in just Sydney, the signs of a possible topping in investor property loan growth and the heightened role of APRA indicates that the property market should not be a constraint on further RBA interest rate cuts. As the RBA has pointed out in the past it needs to set interest rates for the "average" of the economy. And the "average"still points to the need for lower interest rates as the slump in mining investment intensifies, non-mining investment remains weak, iron ore prices are down another 23% since the February RBA cut, the outlook remains for sub trend growth and ongoing spare capacity in the economy and inflation remains benign. This points to the need for further rate cuts to provide a direct boost to spending and an indirect boost via the inducement to a lower Australian dollar. Expect the cash rate to fall to 2% in May with a strong possibility rates will fall below that later this year.
Housing as an investment
Over the very long term residential property adjusted for costs has provided a similar return for investors as Australian shares. Since the 1920s housing has returned 11.1% pa compared to 11.5% pa from shares. See the next chart.
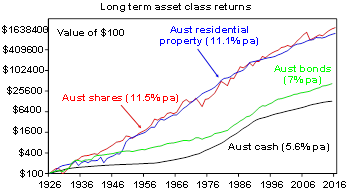
Source: ABS, REIA, Global Financial Data, AMP Capital Investors
They also offer complimentary characteristics: shares are highly liquid and easy to diversify but more volatile whereas property is illiquid but less volatile. And share and property returns tend to have low correlations with each other so including both offers diversification benefits. As a result there is a case for investors to have both in their portfolios over the long term.
In the short term, low interest rates point to further gains in home prices. However, this is likely to be constrained by the economic environment and the impact of tougher prudential scrutiny of bank lending by APRA. Over the next 12 months home price gains are likely to average around 5%, maybe a bit stronger in Sydney and Melbourne (key beneficiaries of the post mining boom rebalancing) but staying negative in Perth and Darwin (as the mining bust continues).
The residential property outlook for the next 5-10 years though is messy. Housing is expensive on all metrics and offers very low rental yields compared to all other assets except bank deposits and Government bonds. The gross rental yield on housing is around 2.9% (after costs this is around 1%), compared to yields of 6% on commercial property and 5.7% for Australian shares (with franking credits). See the next chart.
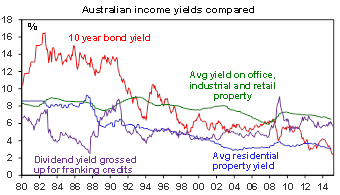
Source: Bloomberg, REIA, AMP Capital
This means that the income flow an investment in housing generates is very low compared to shares and commercial property so a housing investor is more dependent on capital growth to generate a decent return. So for an investor, these other assets continue to represent better value.
- See more at: http://media.amp.com.au/phoenix.zhtml?c=219073&p=irol-oliverArticle&ID=2033356#.dpuf